

PRODUCTIVITY REPORTING FOR ACCOUNTING FIRMS
See performance trends before they become problems.
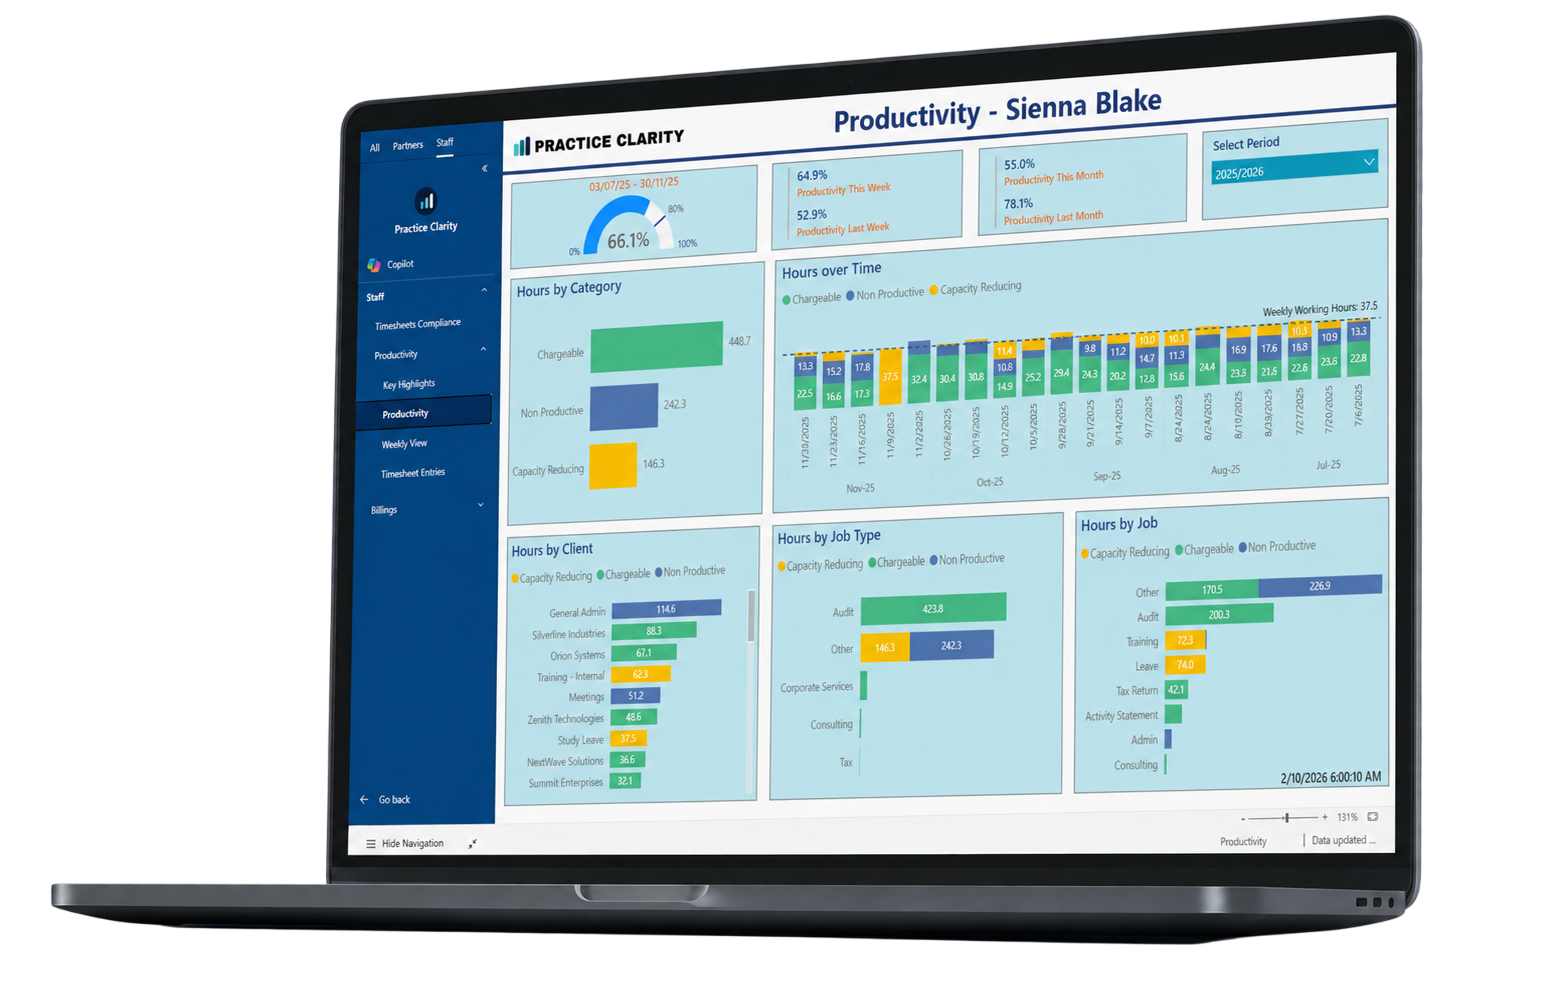
Connect capacity, productive hours, targets, timesheet compliance and individual trends in one reporting suite, giving managers the evidence needed for earlier and more constructive conversations.
Productivity issues usually develop quietly.
Performance rarely changes in one dramatic moment. It drifts over time through incomplete timesheets, changing workloads, non-productive time or capacity that is not translating into chargeable work.
Firm averages hide people
A single percentage can conceal the teams or individuals driving the result.
Targets lack context
A result against target does not explain capacity, role level or workload.
Reviews happen periodically
By the next formal review, a pattern may already be well established.
The reason stays hidden
Without time-entry detail, managers can see the variance but not its cause.
Better reporting turns a headline result into a focused list of exceptions, owners and practical next actions.
Move beyond a single productivity percentage.
Move from the firm-wide position into the people, clients, jobs and underlying detail contributing to it.
Available capacity
Understand the realistic time available after leave, training and other non-productive categories.
Productive hours
See how productive time compares with available capacity.
Performance against target
Compare actual performance with agreed expectations.
Historical trends
Identify gradual improvement or decline before it becomes a larger issue.
Time allocation
Understand where time was spent across chargeable and non-chargeable work.
Entry-level detail
Drill into the individual entries behind any result.
Connect compliance to performance.
Move from recent performance highlights into complete and incomplete time detail without rebuilding the analysis in Excel.

Turn a concern into a clear conversation.
Give managers and partners a shared view of what changed, what sits behind it and where action is required.
See the trend
Identify a pattern before it becomes a formal performance issue.
Add the context
Review capacity, leave, training and workload alongside the result.
Have a specific conversation
Use clear examples instead of vague impressions.
Track what changes
Follow the trend after support or workload changes are introduced.
Questions about this reporting module.
01 What does this module report?
It brings the relevant practice-management data into a focused, interactive Power BI view with filters and drill-through detail.
02 Can managers see only the information relevant to them?
Practice Clarity can support role-based reporting so people receive the level of visibility appropriate to their responsibilities.
03 Does Practice Clarity replace our practice-management system?
No. Your existing system remains the operational source. Practice Clarity provides a clearer reporting layer through Microsoft Power BI.
04 Can we drill into the figures?
Yes. The reporting is designed to move from headline measures to the clients, people, jobs or transactions contributing to the result.
What could earlier productivity visibility change for your team?
Book a tailored walkthrough to explore the productivity views most relevant to your firm.