

PRACTICE INTELLIGENCE FOR ACCOUNTING FIRMS
Gain clarity across your entire accounting firm.
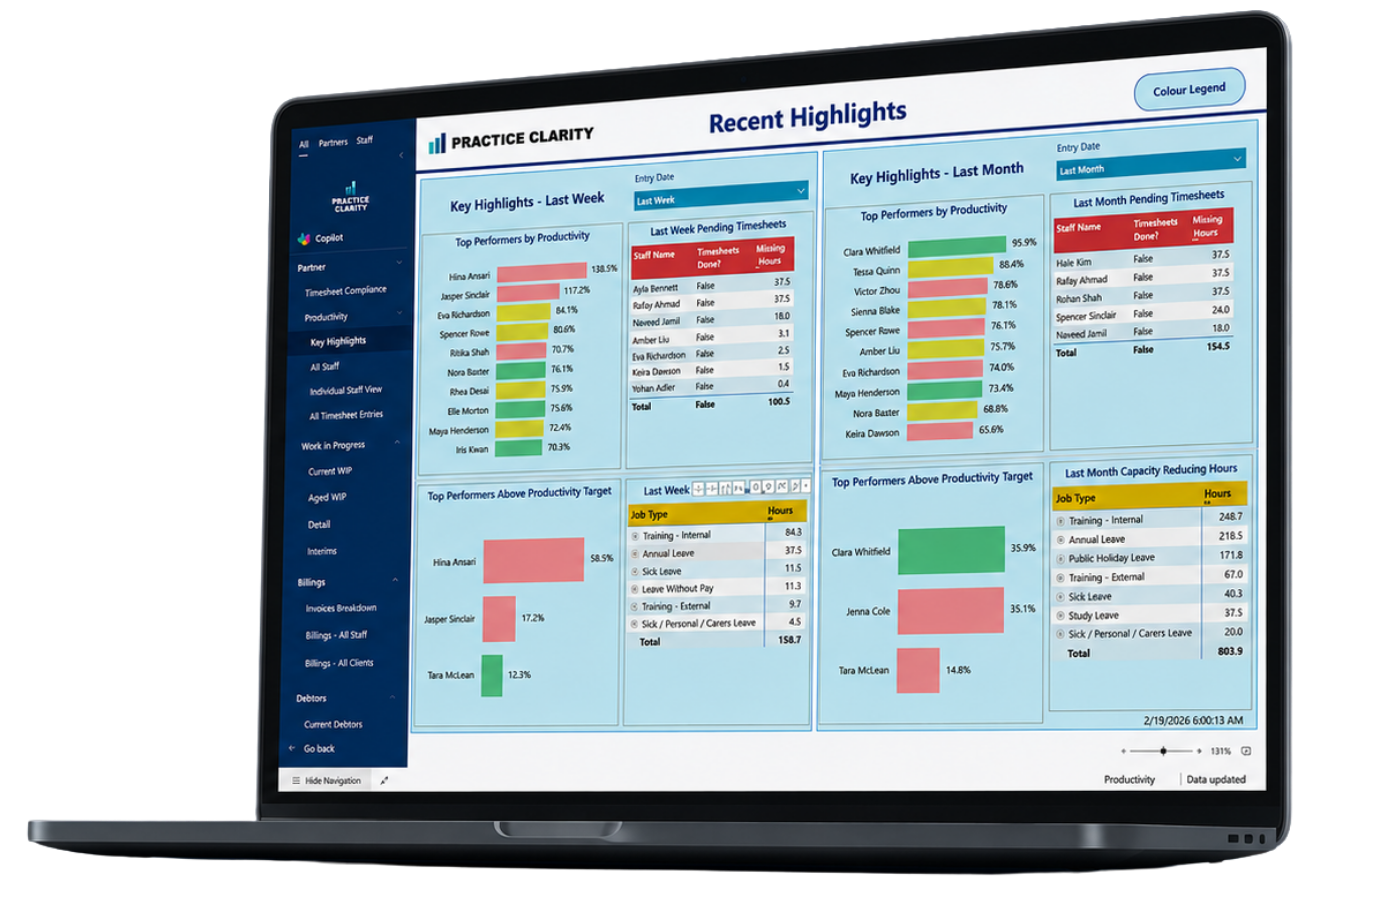
Practice Clarity transforms practice management data into actionable insights for partners, managers and staff, helping firms make better decisions, improve performance and reduce reliance on spreadsheets and manual reporting.
Connects to the systems your firm already runs
The visibility gap
Most accounting firms already have the data. The challenge is turning it into better decisions.
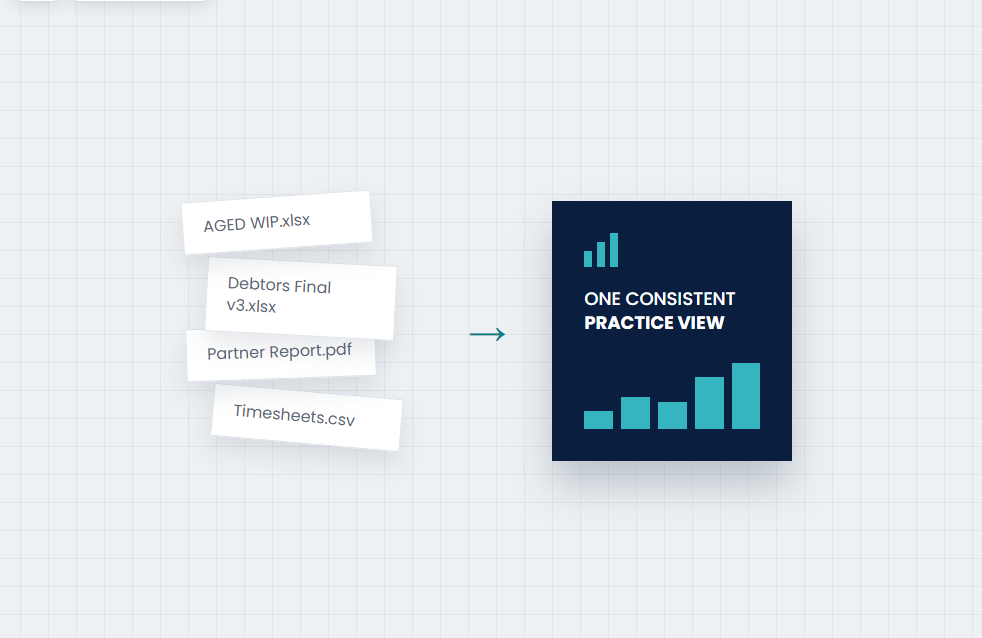
Your firm captures thousands of transactions every week across timesheets, production, WIP, invoices and debtors. But when information is spread across disconnected reports, spreadsheets and exported PDFs, it becomes difficult to answer the questions that matter most.
Productivity
Identify which teams, managers and staff members are achieving productivity targets and where capacity is being lost.
Explore Productivity ReportingWIP
Monitor current WIP, aged WIP and WIP movements before small issues become write-offs or cash flow problems.
Explore WIP ReportingRecoverability
Understand which clients, teams and service lines are converting work into revenue and where margin is being lost.
Explore Recoverability ReportingDebtors
Track overdue invoices, upcoming collections and outstanding balances to improve visibility over cash flow.
Explore Debtor ReportingOne source of truth
Stop assembling reports. Start acting on them.
Practice Clarity helps accounting firms understand how capacity converts into production, WIP, billings, cash flow and profitability.
By connecting productivity, production, WIP, billings, recoverability, debtors and profitability into one reporting model, firms gain a clearer understanding of operational performance and where action is required.
The Reporting Suite
Every recurring headache, solved once.
Five connected views. One consistent model. Automatically refreshed and accessible through your Microsoft environment.
Stop chasing timesheets
See who is behind before it becomes a monthly clean-up job.
View moduleTurn concerns into clear conversations
Compare productive hours, capacity and targets across every level of the firm.
View moduleCatch write-offs before they happen
Surface ageing and problem jobs while there is still time to act.
View moduleFind where margin is leaking
See recovery by staff member, client, manager and partner—not only revenue.
View moduleMake collections proactive
Separate overdue invoices from amounts due this week and next.
View moduleTurn trusted reporting into trusted AI answers.
Practice Clarity combines Microsoft Fabric, Power BI and Microsoft Copilot to help accounting firms explore operational performance using natural language.
Ask questions, investigate trends, understand anomalies and generate report summaries directly within the reporting experience using trusted business definitions and role-based security.
Built for Accounting Firms
Purpose-built semantic reporting model.
Microsoft Fabric
Enterprise reporting and AI foundation.
Role-Based Security
Users only see what they're authorised to access.
Natural Language
Ask questions instead of creating reports.
Example Questions
Which clients have the lowest recoverability?
Why has WIP increased this quarter?
Which managers are below productivity target?
Summarise the key issues on this report.
Accounting firms don’t need more reports.
They need answers.
Practice Clarity helps firm leaders answer critical operational questions:
✓ Which teams are below productivity target?
✓ Which clients generate the highest profitability?
✓ Where is aged WIP accumulating?
✓ Which managers have the largest outstanding debtors?
✓ What is impacting recoverability?
✓ Which jobs are creating write-offs?
✓ How effectively are we converting capacity into revenue?
Instead of searching through multiple systems and spreadsheets, firms can access one trusted source of operational insight.
Built Around Your System
Keep running the work. We’ll make it visible.
Your team continues managing jobs, timesheets and billing exactly as it does today. Practice Clarity connects in read-only mode and turns the data into a reporting layer designed for the people running the firm.
Xero Practice Manager
Bring timesheets, WIP, billing and client data into a consistent practice-performance layer.
Explore XPM reportingMYOB AE / AO
Turn practice data into interactive reporting for partners, managers and team members.
Explore MYOB reportingFYI Elite
Extend workflow and practice data into Power BI dashboards built around how your firm operates.
Explore FYI reportingKarbon
Extend available workflow, client and practice data into connected reporting for clearer firm-wide visibility.
Explore Karbon reportingAPS
Turn available APS practice data into connected reporting across productivity, WIP, billings and debtors.
Explore APS reportingCCH iFirm
Extend available CCH iFirm practice data into a connected Power BI reporting layer for your accounting firm.
Explore CCH iFirm reportingLive in Six Weeks
Set up once.
No disruption to the day-to-day.
Because the reporting modules are purpose-built, the implementation focuses on connecting, validating and configuring—not reinventing the reporting model from scratch.
Connect
Read-only access to your existing practice-management data.
Model
Your data is cleansed and structured in a secure Microsoft environment.
Present
Purpose-built Power BI reporting is configured around your firm.
Embed
Partners, managers and staff receive the right views and training.
Built for Accounting Firms
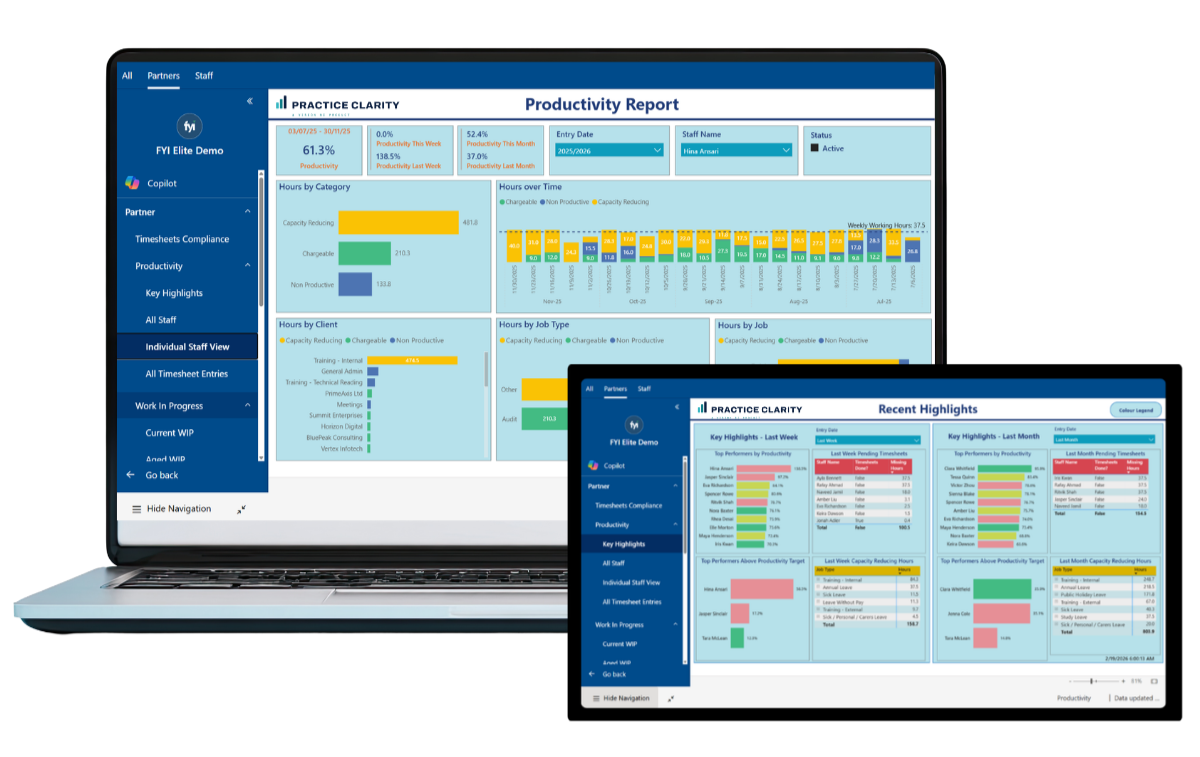
Reporting that already speaks your language.
- Purpose-built reporting modules
- Role-based access for every level of the firm
- Drill-through to the transaction detail
- Ongoing support and platform improvements
WIP ageing. Recoverability. Chargeable hours. Partner, manager and client performance. Nothing is translated from a generic dashboard template.
Choose Your Next Step
Start wherever your firm is today.
You don’t need to be ready for a demonstration to begin improving the way your firm sees its numbers.
Start with the 10 Numbers Guide
Understand the measures that connect capacity, production, WIP, billing and cash.
Download the guideScore your reporting maturity
See where your current reporting is strong and where visibility is breaking down.
Take the scorecardEstimate the potential payback
Model the value of reducing manual reporting effort and improving visibility.
Use the calculatorSee Practice Clarity in action
Book a walkthrough to explore the dashboards most relevant to your firm and ask questions about your reporting needs.
Book a walkthrough
Free guide
Know which numbers turn capacity into cash.
Discover the 10 numbers that reveal whether your firm is converting staff capacity into productive work, billable WIP and collected revenue—and where value may be delayed or quietly lost.
- 01 Capacity and production
- 02 WIP and recoverability
- 03 Billing and collected cash
Enter your details and the guide will be sent directly to your inbox.
Choose Your Next Step
What could clearer reporting change for your firm?
Book a 30-minute walkthrough and we’ll show you how Practice Clarity could work with your practice management system and reporting priorities.