

RECOVERABILITY REPORTING FOR ACCOUNTING FIRMS
See where margin is being protected or lost.
Connect recorded effort, billings, adjustments and write-offs to see where work is converting into fees and where margin is being quietly lost.
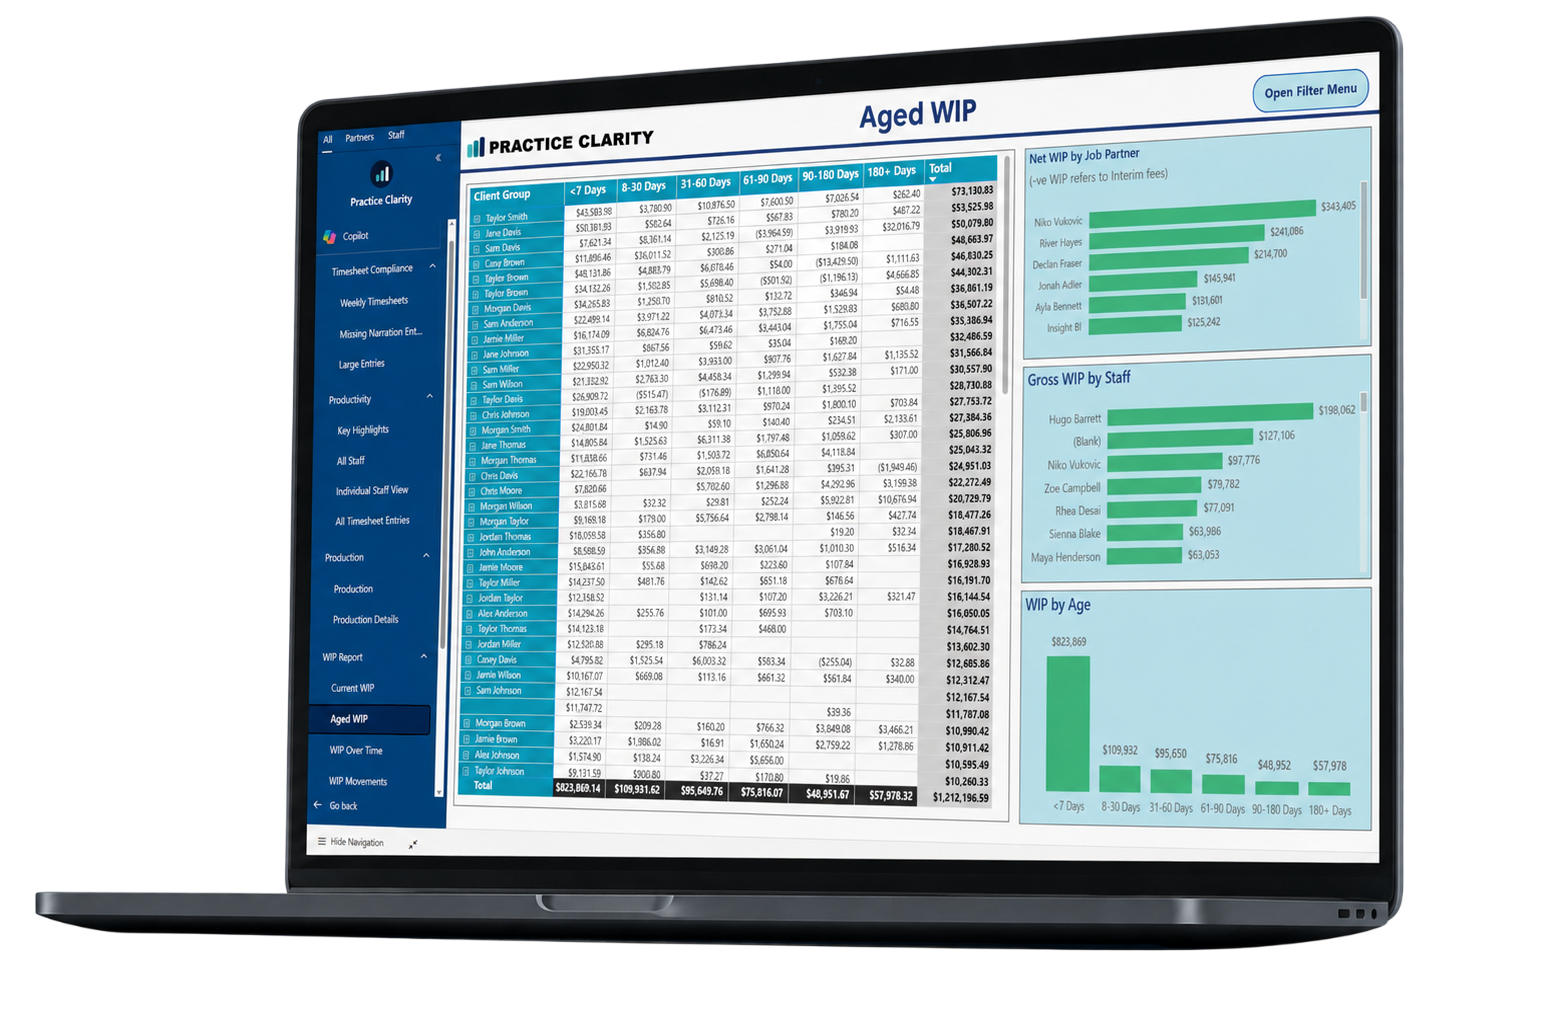
Revenue alone does not show the cost of delivering the work.
A client can generate strong fees while absorbing more time than expected. Without recoverability context, margin leakage stays hidden in adjustments, write-offs and jobs that repeatedly exceed scope.
Fees look healthy
Revenue can appear strong while the underlying effort makes the work less profitable.
Write-offs arrive late
The commercial issue may only become visible when a fee is adjusted or WIP is written off.
Patterns stay hidden
Repeated issues across a client, service line or owner are difficult to see in static reports.
The cause is debated
Without the underlying activity, teams cannot separate pricing, scoping and delivery issues.
Better reporting turns a headline result into a focused list of exceptions, owners and practical next actions.
See where effort is converting into fees and where it is not.
Move from the firm-wide position into the people, clients, jobs and underlying detail contributing to it.
Firm recovery
Monitor the overall relationship between recorded value, fees and adjustments.
Client recovery
Identify clients and groups where commercial outcomes differ from expectations.
Staff and owner views
Compare results by staff member, manager and partner.
Write-off patterns
See where adjustments are concentrated and whether they are repeating.
Recovery over time
Track whether pricing, scoping or delivery changes improve the result.
Underlying activity
Move from the percentage to the work and transactions behind it.
Connect billings, write-offs and recovery.
Use client and staff views to find where recorded effort and invoiced value are moving out of alignment.

Make margin conversations evidence-led.
Give managers and partners a shared view of what changed, what sits behind it and where action is required.
Identify the pattern
Find recurring client, job or ownership trends.
Understand the cause
Separate pricing, scoping, resourcing and delivery issues.
Choose the response
Support clearer fee, scope and workflow decisions.
Measure the change
Track whether the commercial result improves over time.
Questions about this reporting module.
01 What does this module report?
It brings the relevant practice-management data into a focused, interactive Power BI view with filters and drill-through detail.
02 Can managers see only the information relevant to them?
Practice Clarity can support role-based reporting so people receive the level of visibility appropriate to their responsibilities.
03 Does Practice Clarity replace our practice-management system?
No. Your existing system remains the operational source. Practice Clarity provides a clearer reporting layer through Microsoft Power BI.
04 Can we drill into the figures?
Yes. The reporting is designed to move from headline measures to the clients, people, jobs or transactions contributing to the result.
Where is your firm’s margin quietly leaking?
Book a tailored walkthrough to discuss the recoverability views available from your practice data.